I plan to run the motor loop on my pan tracker at 1 kHz on a NUCLEO-H723ZG under FreeRTOS. The Jetson will do the vision and send setpoints over CAN, and the STM32 will close the loop. The PID will use a fixed sample period, so I set a target for the tick itself: period jitter p99 under 2 µs.
An interrupt on this chip should fire within a microsecond every time, making 2 µs a reasonable target. Anything slower means something is getting in its way, like: interrupts being masked, code running from slow flash, or a bad clock. The motor loop itself wouldn’t notice until tens of microseconds, so this target is conservative and could serve as a health check of sorts.
Background
- Jitter
- How much the time between ticks varies. Here it’s each period’s deviation from the mean period.
- p99
- 99% of periods deviate less than this. One outlier can set a min/max, but it barely moves a p99.
- ppm
- Parts per million. +2,400 ppm means a clock runs 0.24% fast, about 2.4 µs per 1 ms tick.
- PSC and ARR
- A timer’s prescaler and auto-reload registers. The prescaler divides the input clock by PSC + 1, and the timer counts up to ARR, then wraps and fires its update interrupt. Period = (PSC + 1) × (ARR + 1) / timer clock.
- DWT and CYCCNT
- The Cortex-M7’s Data Watchpoint and Trace unit. Its CYCCNT register counts CPU cycles, 520 per µs at 520 MHz. Reading it in the ISR gives the period in cycles.
- NVIC priority
- Cortex-M interrupt priority. A lower number is a higher priority, and a higher-priority interrupt can preempt a lower one.
- BASEPRI
- A Cortex-M register that masks every interrupt whose priority number is the same as or larger than the one it’s set to. FreeRTOS uses it for critical sections and masks priorities 5-15, where 5 is
configMAX_SYSCALL_INTERRUPT_PRIORITY. - I-cache
- The M7’s instruction cache. Without it, every instruction is fetched from flash with wait states.
Setup
TIM6 runs off the 260 MHz timer clock and is configured to count at 1 MHz (PSC 259) with interrupts every 1 ms (ARR 999). The ISR does two things:
- Reads
DWT->CYCCNTand keeps the min and max period in cycles (1 ms is 520,000 cycles at 520 MHz), plus the tick count when each one happened. - Toggles PG14, so a logic analyzer sees one edge per tick.
The jitter command on the UART CLI prints the min/max and when they happened. The timestamps came in handy and made the spikes traceable later!
DWT numbers
These are min/max captures over ~30-60 s windows after boot warm-up. There are two capture modes: idle, and “loaded” with three LED fades plus debug logging running:
| Config | Idle | Loaded |
|---|---|---|
| I-cache off, TIM6 priority 5 | ±96 ns | ±7.8 µs |
| I-cache on, TIM6 priority 5 | ±153 ns | ±946 ns |
| I-cache on, TIM6 priority 4 | ±153 ns | ±153 ns |
With the I-cache off, code runs straight from flash with wait states, and the loaded worst case was ±7.8 µs. Turning it on got that down to ±946 ns.
That ±946 ns max was at 21.869 s, and the log had led 1 fade at 21.871 s (smoking gu-… LED!!!). Handling the led command enters FreeRTOS critical sections, and on the Cortex-M7 port those set BASEPRI to mask priorities 5-15. TIM6 was at 5.
I moved TIM6 to priority 4 (using the CubeMX NVIC settings) so it sits above the mask. After that, the “load” made no difference: ±153 ns idle and loaded, which is about 80 cycles of interrupt entry variation. The big trade-off here: the ISR can’t make any FreeRTOS calls including the FromISR functions. (I was sure to add a comment to future Haleigh to remind him of this).
Saleae numbers
Min/max over a minute is noisy and the target is a p99, so I captured PG14 on a Saleae Logic 8 at 100 MS/s, 90 s idle and 90 s loaded. tools/jitter.py turns the Logic 2 CSV export into stats (thanks Claude!). It measures each period against the mean period rather than 1 ms, so a rate offset doesn’t show up as jitter.
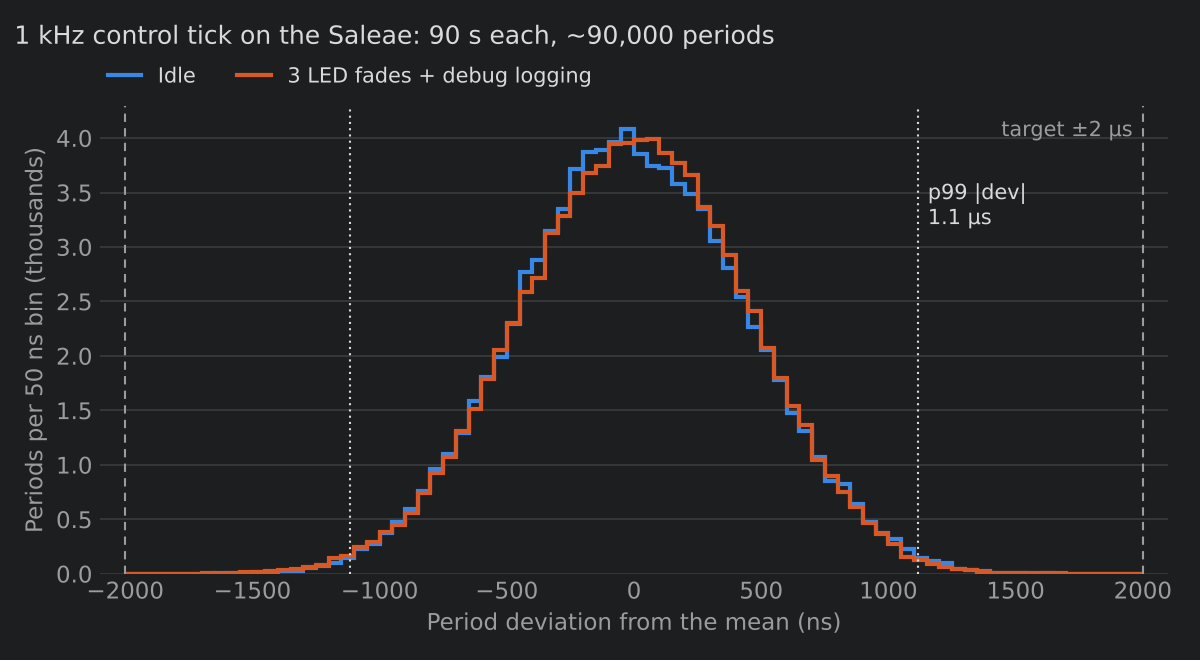
| Capture | Periods | Missed ticks | Rate | Std dev | p99 | Max |
|---|---|---|---|---|---|---|
| Idle | 90,224 | 0 | +2,398 ppm | 444 ns | 1,112 ns | 1,822 ns |
| Loaded | 90,337 | 0 | +2,895 ppm | 443 ns | 1,115 ns | 1,825 ns |
p99 1.1 µs both ways with no missed ticks! Huzzah!
Why the two didn’t match
The DWT said ±153 ns while the Saleae said ±1.1 µs; didn’t change with load. The rate also moved between captures (+2,398 ppm and +2,895 ppm), and TIM6 is hardware-driven, so its rate shouldn’t depend on load.
The DWT counter and TIM6 run off the same clock. If that clock wanders, both wander together and the DWT still sees 520,000 cycles per tick. The Saleae has its own timebase, so it sees the wander. My best guess at the time was the board clock. The tick already met its target, so added further investigation as a “todo”.